


Understanding Average Calculation: Principles and Simple Methods
Average calculation is a fundamental method for summarizing a set of data in a single, representative form. In 2025, this technique continues to gain traction in both academic and professional fields, facilitating decision-making through a clear synthesis of available information.
The arithmetic mean is calculated by adding all the values in a series and then dividing the result by the total number of items. Let’s illustrate this method with a concrete example: consider a series of school grades such as 12, 14, 6.5, 20, 5, and 17.5. Adding these numbers gives a total of 75, which is then divided by 6, the number of students or data points. The result, 12.5, represents the overall average of this series.
This simple and intuitive technique is perfectly suited to school assessments, where each grade counts equally to obtain a comprehensive view of performance. It is also used in personal financial management to estimate average expenses or income.
It is important to note that the arithmetic mean does not always perfectly reflect certain data sets, especially when extreme values skew the result. To overcome this limitation, other statistical measures such as the median and the mode are often used in conjunction. Digital tools and software such as Excel, Google Sheets, or LibreOffice Calc now facilitate these calculations. By inputting a series of values, they quickly provide not only the mean, but also other useful statistics for a comprehensive analysis.
Indeed, many programs, including Statistica and SPSS, also allow you to manage weighted averages, which assign different weights to each value based on its relevance. For example, in business accounting, certain expenses or revenues can have a greater impact on the overall average due to their significance.
To delve deeper into these concepts, educational resources like Khan Academy offer detailed courses on the fundamentals of statistical calculation. This provides a solid foundation for anyone wishing to master these concepts in a professional or academic setting.
In short, understanding the principles behind calculating an average and its various applications is a valuable skill. It not only allows you to gain a clear picture of the data but also to make informed decisions in different sectors.
Learn how to easily calculate an average with our simple explanations and practical examples. Ideal for students, teachers, or anyone wishing to understand this basic mathematical concept. The Essential Steps to Calculate an Arithmetic Mean Simply and Effectively
Calculating the arithmetic mean, often presented as a basic operation, actually requires methodological rigor to ensure the accuracy of the results. By following a clear process, any user—whether student, professional, or manager—can easily achieve this.
The first step is to gather all the relevant values. For example, a student wishing to calculate the average of their grades must first collect each result obtained over the given period. This can be applied to other contexts, such as analyzing monthly expenses for a family or a business.
Next, you need to calculate the exact sum of these values. Accuracy is essential to avoid potential errors that could affect the final average. A typical example would be a retailer adding up their weekly sales to assess a trend.
The third step requires accurately counting the total number of items in the series. This number will serve as the divisor in the final calculation. For example, a marketing team might count the number of campaigns run over a period to calculate an average performance.
Finally, simply divide the sum obtained by the number of items. This operation gives the simple arithmetic mean. In every sector, this value serves as a benchmark for comparing performance or trends.
For more complex calculations, such as those involving coefficients (for example, in accounting or when calculating weighted averages using software like Tableau or Numbers), it’s advisable to perform preliminary multiplications before division.
To facilitate these calculations, modern tools offer various interactive features. For example, OpenOffice software allows for simple data management while offering advanced statistical analysis capabilities. Matplotlib, a Python library, allows for the graphical visualization of this data, which helps in understanding potential discrepancies or anomalies.
Furthermore, verifying results before final validation is a good practice to adopt systematically. Data entry errors or omissions in the list of values can skew the calculation, negatively impacting any subsequent analysis.
This is why online tutorials and educational platforms like Khan Academy are an excellent resource for learning these procedures step by step and integrating these best practices.
Practical Applications of Average Calculation in Different Sectors
Average calculation has numerous applications in today’s world, both in everyday life and in professional settings. Its role is to ensure a quick and concise understanding of data collected in various contexts.
In personal finance, averages are widely used to track monthly income and expenses. Individuals analyze their spending habits by calculating a monthly average, allowing them to better manage their budget. This method is essential for anticipating seasonal fluctuations or unexpected expenses.
Businesses also make extensive use of average calculation. When analyzing their results, companies rely on averages to assess productivity, revenue, or customer satisfaction. For example, a company might calculate its average weekly production to adjust its inventory management strategy. This information is also used in advanced statistical analysis with software like SPSS for more refined decision-making.
Furthermore, in industrial or scientific sectors, averages facilitate the comparison of product batches or series of experiments. Repeated measurements allow for the calculation of a representative average value, indicating standard quality or performance.
This ability to summarize a large volume of data into a single value has become essential with the widespread adoption of big data. Integrating statistical visualizations using tools like Matplotlib or Tableau also enhances the understanding of trends and anomalies.
To better grasp these interactions between data and decisions, it is advisable to learn more about
digital transformation and information management in business.
Using digital tools to automate and optimize average calculation
By 2025, digital tools for calculating averages have improved considerably, facilitating access to fast and reliable results adapted to all types of data. This is all the more useful given the rise of Big Data and the need for precise analyses in many sectors.
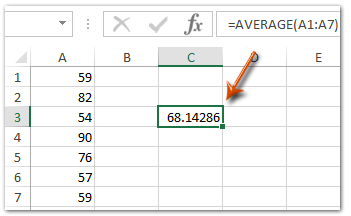
Standard software such as Excel, Google Sheets, LibreOffice Calc, and Numbers allows anyone to easily calculate a simple or weighted average using built-in functions. For example, in Excel, the AVERAGE function calculates the average of a series of numbers, while AVERAGEIF allows you to include only the values that meet a given criterion.
For more advanced analyses, specialized software such as Statistica or SPSS becomes essential. These tools offer advanced features for analyzing not only the average but also other descriptive statistics, enabling better interpretation of the results and the adaptation of strategies accordingly.
Visualization tools such as Tableau and Matplotlib add another dimension by graphically representing data. This helps to quickly detect trends, outliers, or correlations between series. Clear visualization thus improves the understanding and presentation of the results obtained.
Furthermore, numerous online tutorials now support users in this digital transition. Educational platforms like Khan Academy offer courses accessible to all levels, explaining how to use these tools effectively and avoid the most common mistakes.
Optimizing energy management or personal finances by relying on average calculations becomes easier thanks to these accessible technologies. For example, to track expenses, data entry and calculations can be automated via Google Sheets, monthly budgets adjusted based on calculated averages, and thus better anticipate financial needs.
If you wish to delve deeper into the digital approach, this article offers suggestions for